
How KanBo Empowers Large Companies with Advanced Portfolio Analytics
How KanBo Empowers Large Companies with Advanced Portfolio Analytics
In the realm of large companies, having a robust portfolio analytics tool is pivotal for dissecting portfolio activity, scrutinizing risk and return, and making informed decisions. KanBo emerges as a quintessential platform that underpins portfolio analytics at an advanced level. Its structured approach, combined with a suite of features, aligns seamlessly with the needs of C-Level executives, directors, managers, head of departments, knowledge workers, and other stakeholders in global enterprises.
Portfolio Analytics with KanBo: A Comprehensive Overview
Portfolio Analytics, within the KanBo ecosystem, is not just about providing data; it's about offering insights. Through precise monitoring, analysis, and reporting of portfolio activities, holdings, or performance, KanBo helps in making the complex simple. This is achieved through a coalition of features designed to furnish stakeholders with nuanced understanding and granular control over their portfolio analysis.
Key Features Enabling Advanced Portfolio Analytics in KanBo:
- Card Statistics: The Card Statistics feature in KanBo sheds light on the progress and lifecycle of a card, providing insights into efficiency, workflow, and projections of meeting deadlines. This feature accumulates and visualizes data that are crucial for portfolio analysis, enabling managers to make predictive decisions and adjust strategies accordingly.

- Custom Fields: Customizability sits at the core of KanBo's analytics capability. Custom Fields allow teams to tailor their portfolio analytics by adding specific data points that are relevant to their analysis. This ability to define and label data as per specific requirements furthers the depth of portfolio analysis, enabling a nuanced examination of risk and returns across different portfolio items.

- Table View: Table View in KanBo presents portfolio data in a tabular format. This facilitates easy comparison and analysis of various metrics critical for assessing portfolio performance. It acts as a dynamic spreadsheet but within the collaborative and centralized ecosystem of KanBo, ensuring that all portfolio analytics are easily accessible to all stakeholders.

- Forecast Chart View: For forward-looking analytics, the Forecast Chart View offers projections based on current data trends. This feature allows executives to visualize future portfolio performance under different scenarios, making it an indispensable tool for risk assessment and strategic planning.
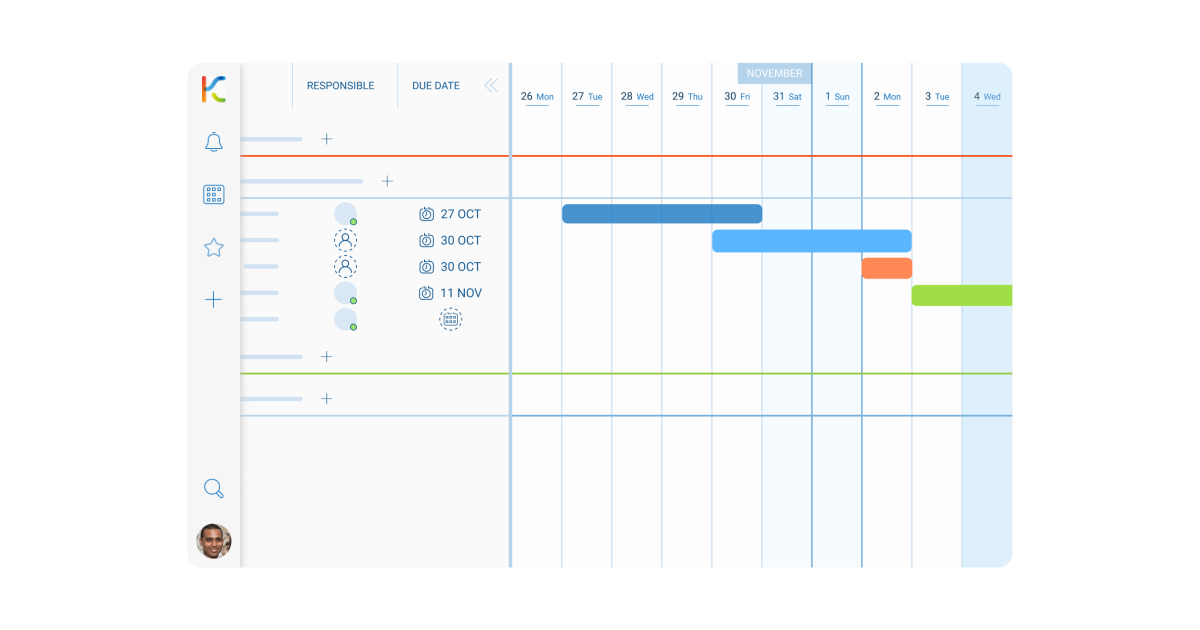
- Gantt Chart View: The Gantt Chart View aids in visualizing the timeline of portfolio projects and tasks, providing clear insights into schedules, dependencies, and progress. For portfolio managers focusing on delivering projects within promised timelines while managing resources efficiently, this feature is invaluable.
- Search and Filter: Leveraging KanBo's Search and Filtering Cards features enhances the capability to drill down into the portfolio for specific insights. Whether it's tracking the performance of certain assets or understanding the status of various initiatives, these features ensure that every piece of data is just a few clicks away.


- Activity Stream: The comprehensive Activity Stream within KanBo captures all updates and changes across the portfolio in real-time. This continuous stream of information is pivotal for stakeholders aiming to monitor portfolio activity closely, identify trends, and respond proactively to any red flags.

Conclusion
Through KanBo’s advanced portfolio analytics capabilities, large companies can navigate the complexities of portfolio management with ease. The platform’s rich feature set, rooted in the component business model concept, enables a holistic examination of portfolio activities, making it a linchpin for global enterprises aiming to optimize their strategic oversight and operational efficiency in portfolio management.