Table of Contents
KanBo – The Pharma-Focused Work Coordination Maestro
Experience ultimate task alignment, communication and collaboration
Trusted globally, KanBo, bridges the gap between management and engineering in complex pharmaceutical organizations. Seamless coordination, advanced project planning, and outstanding leadership are made possible through our versatile software. Stride toward your mission-critical goals with superior collaboration and communication.
KanBo Business Intelligence Developer in the Pharmaceutical Industry: Harnessing Data for Effective Collaboration
What do readers need to know about this challenge?
In the realm of the pharmaceutical industry, a Business Intelligence Developer grapples with the critical challenge of synthesizing complex data sets into comprehensible and actionable insights. This involves converting raw data into dashboards and reports that not only track business performance but also tell a compelling story to various stakeholders through data visualization.
What reader can do with KanBo to solve this challenge?
- Collaborative Designing: Utilize Grouping to collaborate effectively on data visualization projects by organizing tasks related to dashboard creation and feature implementation around specific users or statuses.

- Real-time Feedback: Take advantage of the activity stream to maintain an updated and interactive log of changes and communications during the dashboard design process, fostering transparency and teamwork.

- Data Organization: Use the Table view to organize and present data metrics in an accessible format that can be reviewed and shared with team members for consistent information dissemination.

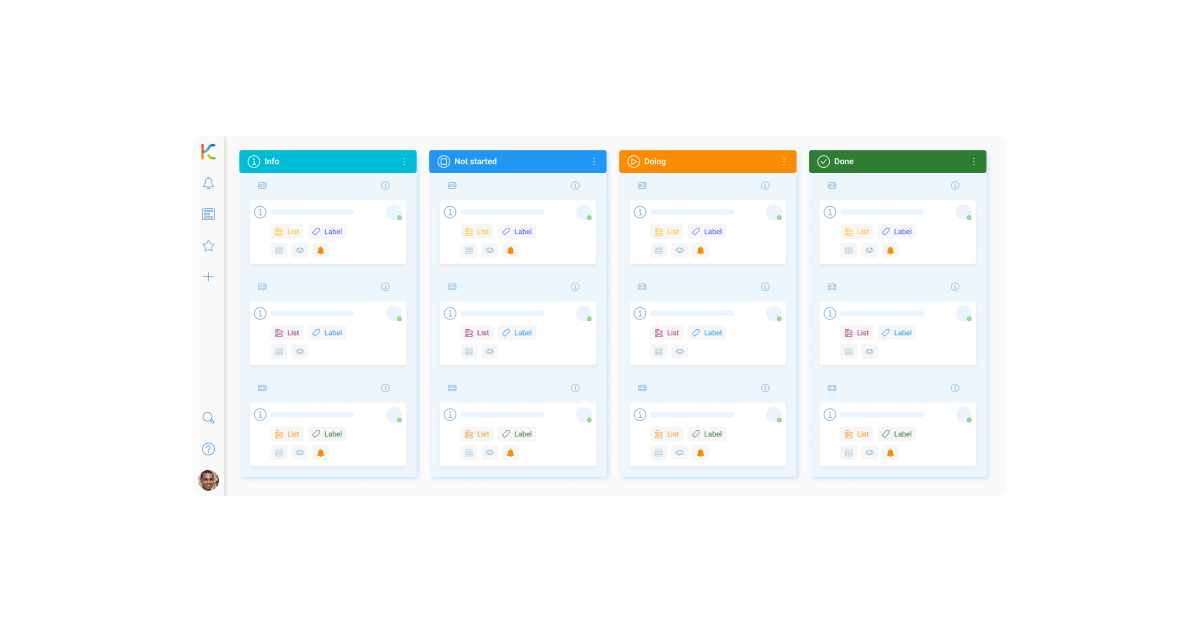
- Progress Monitoring: Apply the Kanban view to visualize the workflow of BI projects, tracking the progress of each task from initiation to completion and optimizing the distribution of workloads.
- Efficient Searching: Deploy KanBo Search to swiftly navigate through large sets of data points, aiding in the quick retrieval of relevant information during the development of reports and dashboards.

- Documentation Control: Implement document source integration to effectively manage report documentation, ensuring all stakeholders have consistent access to the latest versions of data models and reports.

What reader can expect after solving this challenge?
By leveraging KanBo's various features to streamline the dashboard and reporting development process, readers can anticipate a host of long-term benefits. Enhanced collaboration will result in more efficient data-driven decision-making. There will be reduced redundancy and improved accuracy in data analysis, facilitated by real-time updates and centralized document management. Additionally, the adoption of KanBo's visual tools for task management will likely promote better resource allocation and time management within BI projects. As the collaborative processes mature, KanBo's iterative improvements are expected to offer even more sophisticated functionalities to address complex data visualization and reporting needs, securing its role as a valuable tool for the successful Business Intelligence Developer.
Table of Contents
KanBo – The Pharma-Focused Work Coordination Maestro
Experience ultimate task alignment, communication and collaboration
Trusted globally, KanBo, bridges the gap between management and engineering in complex pharmaceutical organizations. Seamless coordination, advanced project planning, and outstanding leadership are made possible through our versatile software. Stride toward your mission-critical goals with superior collaboration and communication.
KanBo Business Intelligence Developer in the Pharmaceutical Industry: Harnessing Data for Effective Collaboration
What do readers need to know about this challenge?
In the realm of the pharmaceutical industry, a Business Intelligence Developer grapples with the critical challenge of synthesizing complex data sets into comprehensible and actionable insights. This involves converting raw data into dashboards and reports that not only track business performance but also tell a compelling story to various stakeholders through data visualization.
What reader can do with KanBo to solve this challenge?
- Collaborative Designing: Utilize Grouping to collaborate effectively on data visualization projects by organizing tasks related to dashboard creation and feature implementation around specific users or statuses.
- Real-time Feedback: Take advantage of the activity stream to maintain an updated and interactive log of changes and communications during the dashboard design process, fostering transparency and teamwork.
- Data Organization: Use the Table view to organize and present data metrics in an accessible format that can be reviewed and shared with team members for consistent information dissemination.
- Progress Monitoring: Apply the Kanban view to visualize the workflow of BI projects, tracking the progress of each task from initiation to completion and optimizing the distribution of workloads.
- Efficient Searching: Deploy KanBo Search to swiftly navigate through large sets of data points, aiding in the quick retrieval of relevant information during the development of reports and dashboards.
- Documentation Control: Implement document source integration to effectively manage report documentation, ensuring all stakeholders have consistent access to the latest versions of data models and reports.
What reader can expect after solving this challenge?
By leveraging KanBo's various features to streamline the dashboard and reporting development process, readers can anticipate a host of long-term benefits. Enhanced collaboration will result in more efficient data-driven decision-making. There will be reduced redundancy and improved accuracy in data analysis, facilitated by real-time updates and centralized document management. Additionally, the adoption of KanBo's visual tools for task management will likely promote better resource allocation and time management within BI projects. As the collaborative processes mature, KanBo's iterative improvements are expected to offer even more sophisticated functionalities to address complex data visualization and reporting needs, securing its role as a valuable tool for the successful Business Intelligence Developer.