
Table of Contents
Work coordination platform
Designed for the automotive industry
As a leader in innovation, you understand the importance of staying ahead of the curve in the fast-moving automotive 4.0 world. KanBo provides you with the tools to do just that by facilitating smart factory operations, streamlining project management, fostering collaboration and solving complex problems.
Harnessing Gantt Chart View for Comprehensive Project Overview in Automotive Industry
Best Practice
Utilizing KanBo’s Gantt Chart View feature
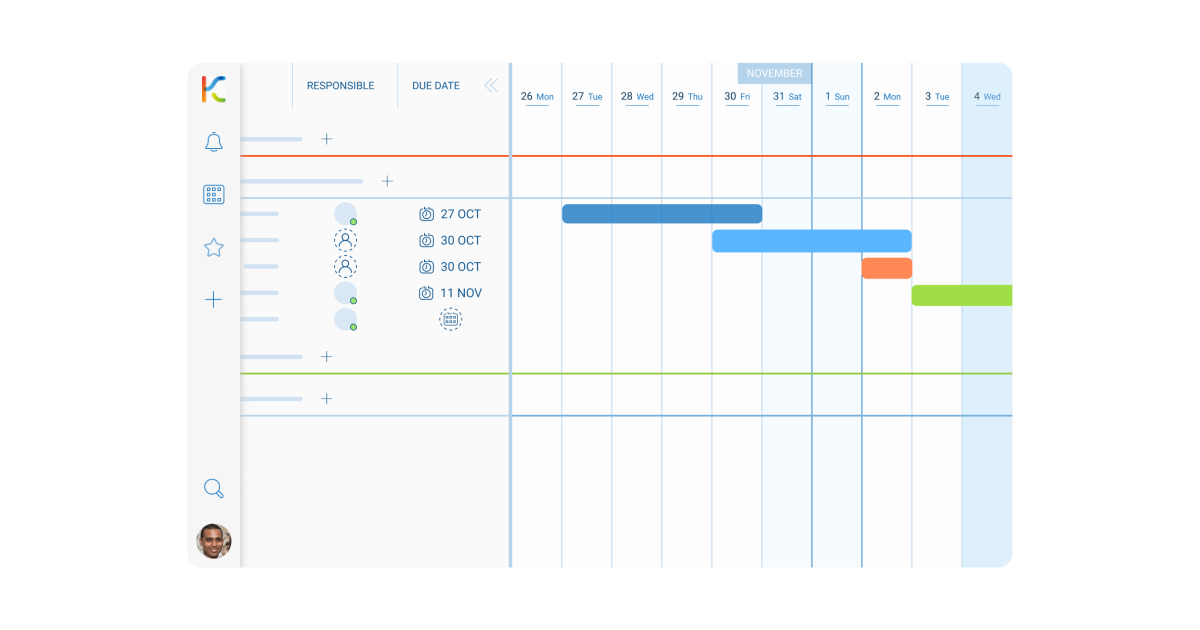
KanBo’s Gantt Chart view is designed to provide a comprehensive visual representation of a project schedule, aiding in advanced project management. This sophisticated function is particularly effective in sectors where intricate orchestrations, such as in the automotive industry, necessitate exceptional organizational tools.
This best practice was established to offer a solution to the common challenge of gaining a complete project overview, specifically in complex settings like automotive industries. It is aimed at enabling project managers and team members to visibly comprehend the progression of work, identify interdependencies, and implement necessary modifications seamlessly.
The automotive industry is characterized by complex processes, intricate planning, and stringent deadlines. Therefore, gaining a comprehensive project overview is crucial to managing resources efficiently, minimizing delays, and maintaining visibility into the project status.

Challenge
The challenge lies in managing large-scale automotive projects where conventional tools such as spreadsheets are insufficient for understanding project progress, visualizing task dependencies, and implementing changes fluidly.
Solution
Gantt Chart view
This feature provides a robust overview of project timelines, tasks, and milestones in a chronological bar chart format. This visualization allows project members to understand the project's progression, take note of deadlines, and effectively plan resources.

The reasons for selecting this function are
Comprehensive Overview
The Gantt Chart view aids in understanding the 'big picture' of the project, mapping individual tasks against the project timeline.
Task Dependencies
The Gantt Chart can effectively show the dependence of one task on another, helping to plan tasks more efficiently.
Resource Planning
Visually accessible project timeline helps in effective resource allocation and workload management.
Daily Routine
Integrate the use of Gantt Chart view in the daily management of tasks and overall project planning.
Use Case
An automotive industry team used KanBo’s Gantt Chart view to efficiently manage the timeline of their new car design project. The Gantt Chart view helped them visualize their project timeline, understand task dependencies, and implement changes easily when necessary.
KanBo Tips
Use the drill-down functionality of the Gantt Chart view to get detailed visibility of tasks. Regularly update the chart to reflect the current status and changes in the project.
Get started on creating a more efficient and streamlined product design process today with KanBo for Automotive.

Table of Contents
Work coordination platform
Designed for the automotive industry
As a leader in innovation, you understand the importance of staying ahead of the curve in the fast-moving automotive 4.0 world. KanBo provides you with the tools to do just that by facilitating smart factory operations, streamlining project management, fostering collaboration and solving complex problems.
Harnessing Gantt Chart View for Comprehensive Project Overview in Automotive Industry
Best Practice
Utilizing KanBo’s Gantt Chart View feature
KanBo’s Gantt Chart view is designed to provide a comprehensive visual representation of a project schedule, aiding in advanced project management. This sophisticated function is particularly effective in sectors where intricate orchestrations, such as in the automotive industry, necessitate exceptional organizational tools.
This best practice was established to offer a solution to the common challenge of gaining a complete project overview, specifically in complex settings like automotive industries. It is aimed at enabling project managers and team members to visibly comprehend the progression of work, identify interdependencies, and implement necessary modifications seamlessly.
The automotive industry is characterized by complex processes, intricate planning, and stringent deadlines. Therefore, gaining a comprehensive project overview is crucial to managing resources efficiently, minimizing delays, and maintaining visibility into the project status.
Challenge
The challenge lies in managing large-scale automotive projects where conventional tools such as spreadsheets are insufficient for understanding project progress, visualizing task dependencies, and implementing changes fluidly.
Solution
Gantt Chart view
This feature provides a robust overview of project timelines, tasks, and milestones in a chronological bar chart format. This visualization allows project members to understand the project's progression, take note of deadlines, and effectively plan resources.
The reasons for selecting this function are
Comprehensive Overview
The Gantt Chart view aids in understanding the 'big picture' of the project, mapping individual tasks against the project timeline.
Task Dependencies
The Gantt Chart can effectively show the dependence of one task on another, helping to plan tasks more efficiently.
Resource Planning
Visually accessible project timeline helps in effective resource allocation and workload management.
Daily Routine
Integrate the use of Gantt Chart view in the daily management of tasks and overall project planning.
Use Case
An automotive industry team used KanBo’s Gantt Chart view to efficiently manage the timeline of their new car design project. The Gantt Chart view helped them visualize their project timeline, understand task dependencies, and implement changes easily when necessary.
KanBo Tips
Use the drill-down functionality of the Gantt Chart view to get detailed visibility of tasks. Regularly update the chart to reflect the current status and changes in the project.
Get started on creating a more efficient and streamlined product design process today with KanBo for Automotive.